4.7 Sankey - transition diagrams
Sankey diagrams are a way to visualize transitions between statuses. In microdata.no, this can be used to get an overview of units' (individual's) movements between two or more time-measurements, either for the same variable or for different variables. Movements between different types of states (e.g. jobsearch status job status) can be viewed, or changes in distributions for the same variable over time (e.g. residence16 residence19 or maritalstate16 maritalstate19).
The transition visualization requires categorical cross-sectional variables to be used. The number of categories should not be too large, as the chart can quickly become unreadable. This can be solved by converting into fewer categories or by using an if-condition that controls which transitions to study.
By holding the mouse cursor over a transition field, the corresponding number of units are shown.
For more information about this command, use the help sankey command. This will display syntax examples and a complete list of available options that can be used to customize the appearance of the statistics generated.
Examples:
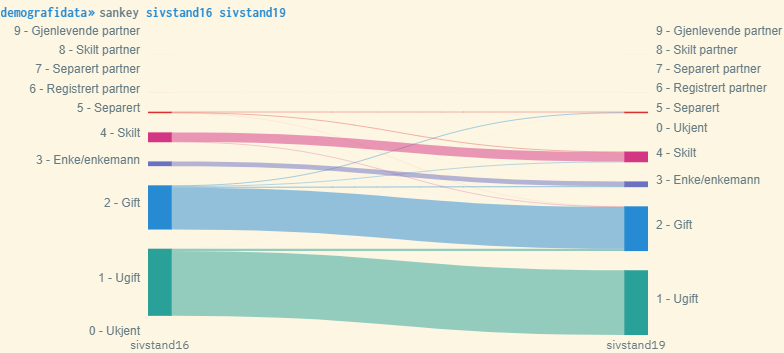
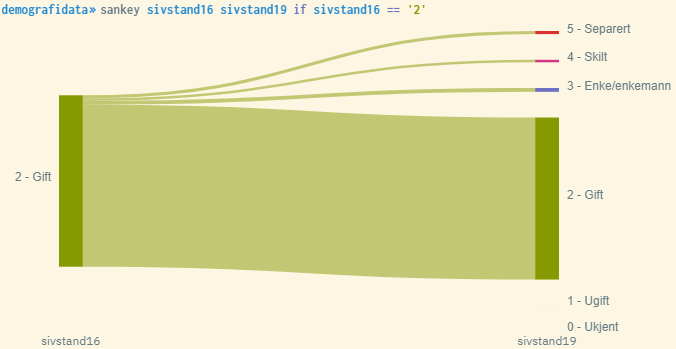
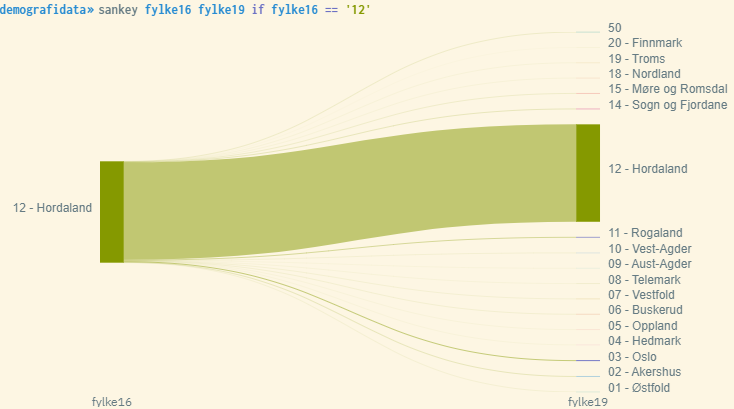
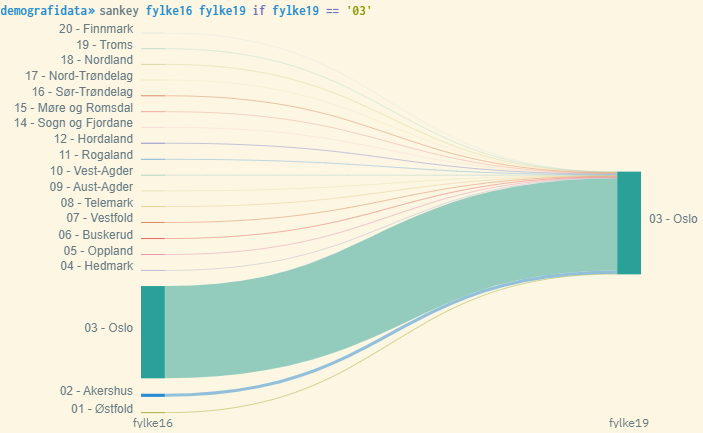
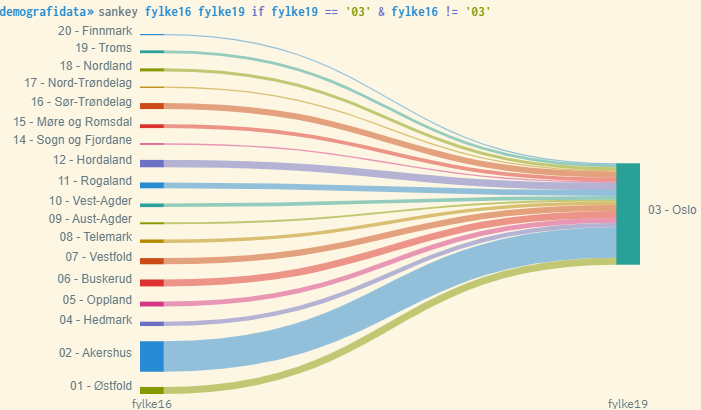
Examples of using sankey with two measurements (one transition)
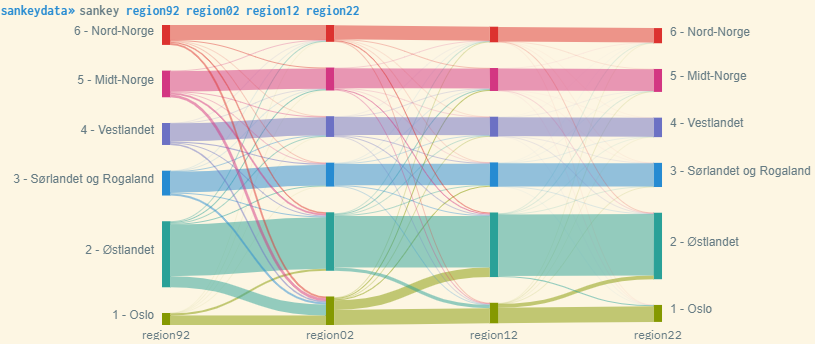
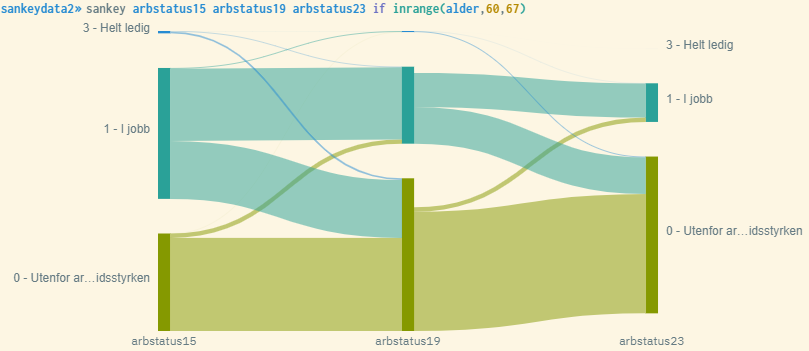
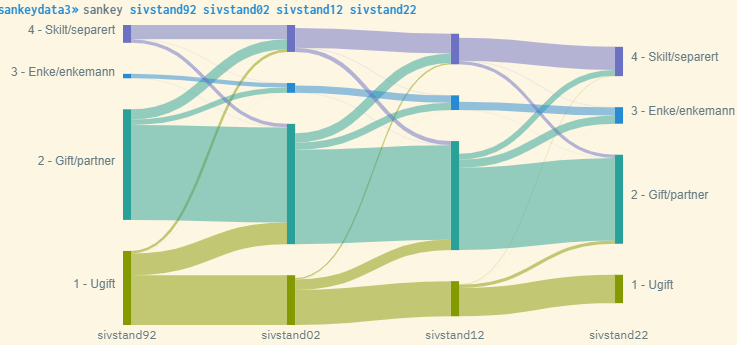
Examples of using sankey with more than two measurements (more transitions)